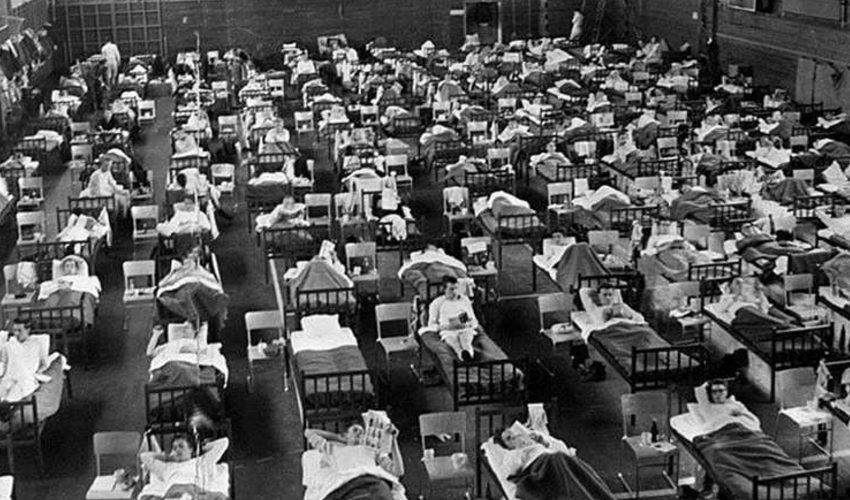
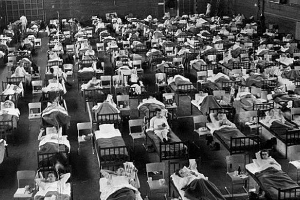
The Spanish Flu of 1918 was a tragedy of gargantuan proportions. Globally, one-third of all human beings were infected by the disease and roughly 50 million people died. There is no clear consensus about where the virus originated but the focal point of the pandemic in terms of the death toll was India (where it was called the Bombay Influenza or Bombay Fever) with an estimated 10 to 20 million deaths – roughly 6% of the Indian population.
Even so, it has almost been wiped out from public memory. Perhaps part of the reason is that pandemics, even if as deadly, do not capture public imagination in the way wars tend to. Another big reason could be that there has not been nearly enough writing on, and therefore, awareness of the extent of damage in India.
In recent years, the Spanish flu has been resurrected in public memory due to renewed interest in influenza epidemics across the globe. In 2012 the work of economist Siddharth Chandra, estimated the death toll in India and contributed significantly to the understanding of the Spanish flu spread in the country beyond the anecdotal documentation that has existed.
Unlike COVID19 the virus was of the H1N1 strain with genes of avian origin but, like COVID-19, it was transmitted via respiratory droplets. As with COVID-19, older adults were most at risk of developing severe symptoms. However, in stark contrast to COVID-19, the Spanish flu also impacted children under the age of 5 and adults aged 20–40. In fact, a 25-year-old was more likely to die from the Spanish flu than a 74-year-old was. This is unusual for a flu.
COVID-19, however, generally affects children in relatively minor ways, and adults aged 20–40 are significantly less likely to develop severe symptoms than older adults.
As with swine flu, it may be that older adults at the time of the Spanish Flu had a pre-existing immunity to a similar pathogen. Perhaps the 1889–1890 flu pandemic, or the Russian flu, afforded some protection to those who survived it.
Additionally, some scientists believe that younger people’s vigorous immune responses might have led to more severe lung symptoms due to “exuberant pulmonary exudation.” In other words, the strong immune responses of young people may produce excess fluid in the lungs, making breathing even more difficult.
At the time, there were no vaccines to prevent the disease and no antibiotics to treat the bacterial infections that sometimes developed alongside it. The virulent nature of this particular H1N1 strain and the lack of medication available made this the most severe pandemic in recent history.
Chandra’s study uses a comprehensive dataset to identify important features of the 1918–19 influenza pandemic in India that are of interest for the understanding of influenza epidemics.
India experienced two distinct epidemic waves:
– A mild one in the spring or summer of 1918,
– And a second and much more lethal one in the autumn or winter.
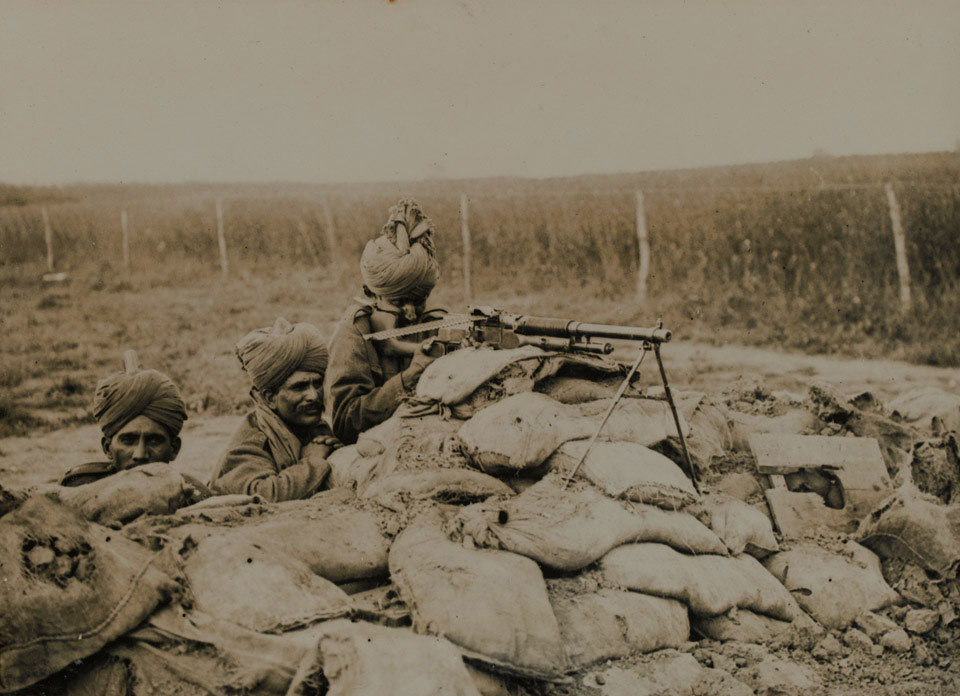
In India, the second wave originated in Bombay in September 1918, simultaneously spreading north and south, and reaching Sri Lanka and the northern Indian provinces in October 1918. The pandemic is believed to have originated from influenza-infected World War I troops returning home. The disease was passed on to and spread amongst civilian populations in different regions. Transportation systems aided the spread of the disease. In the case of India, the Sanitary Commissioner in his report noted that: “The railway played a prominent part as was inevitable.”
This study estimates weekly deaths in 213 districts from nine provinces in India. It computes statistical measures of the severity, speed, and duration of the virulent autumn wave of the disease as it evolved and diffused throughout India. These estimates create a clear picture of the spread of the pandemic across India.


It would have been better to use data on the number of influenza cases but that is unavailable, so the focus of this paper is on what the mortality statistics reveal instead. The data considered shows a steep spike in fever mortality in late 1918, reflecting the autumn wave of the pandemic. While the “fever” heading may also have contained deaths from other fever-causing diseases, most importantly seasonal malaria, the study focuses on the “fevers” data category for this analysis after adjusting it for the presence of seasonal fever deaths from all causes.
The provincial death rate in the Bombay Presidency was a relatively high 54.9 people per thousand inhabitants. The corresponding figures for other major cities included:
– for Madras, a start in the week of September 14–21, a peak during the week of October 13–19, a start-to-peak duration of four weeks, and a death rate of 16.7.
– For Calcutta, the figures included a start during the week of September 14–21, a maximum death rate during the week of November 16–23, a start-to-peak duration of eight weeks, and a provincial death rate of 8.5.

Different regions of India experienced successive episodes of peak mortality. The week of October 13, 1918 shows the early regional peaks in the western province of Bombay, the south-eastern province of Madras, and a small area on the eastern coast of India, in current day Orissa. Four weeks later, the epidemic peaked in the Central Provinces and the northwestern province of Punjab (week of November 10). Finally, another four weeks later, the epidemic peaked in the northern and eastern parts of the United Provinces, Bihar, and Bengal (week of December 8). This last set of peaks appears more scattered and sporadic than the more synchronous peaks seen in Bombay, Madras, the Central Provinces, and Punjab.
The study clearly shows that, over time:
(a) the severity of the epidemic diminished,
(b) the velocity (average time to death) of the wave slowed down,
(c) the wave grew longer in duration, and
(d) the eastern portions of India were the last to experience the pandemic.
In terms of severity, Bombay, the Central Provinces, and parts of Madras were hardest hit. The highest velocity (lowest mean time to mortality) districts appear to be concentrated in Bombay, the Central Provinces, and Punjab as are the shortest duration districts. The earliest midpoint districts, likewise, are concentrated in Bombay, the Central Provinces, and parts of Madras and Punjab.

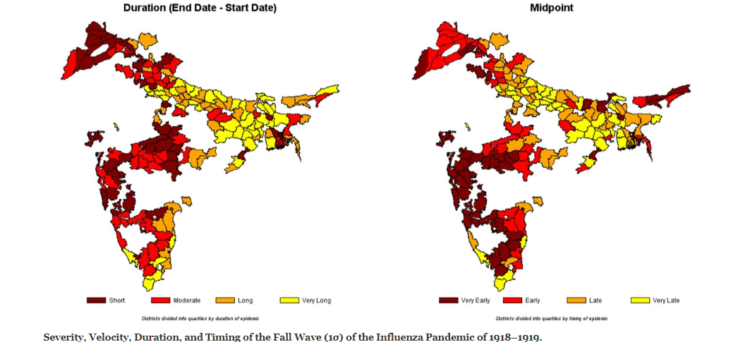
The diminishing virulence and velocity of the epidemic wave and its lengthening as it progressed through India raises the important epidemiological question of why. Analyzing diffusion patterns of pandemics is difficult, as it depends upon various factors including place-specific public health responses, social interactions among people, travel patterns within cities and across countries, the natural and built environments, and characteristics of the pathogens themselves. But a couple of explanations seem feasible.
Key among them is an important theme in the theory of evolution of epidemics – competition among strains of a rapidly evolving virus can produce an equilibrium in which the predominant strain is less virulent and slower to travel than the strain that predominated at the onset of the epidemic.
A second key explanation could be weather. Recent studies suggest that absolute humidity constrains both influenza virus survival and transmission efficiency. The crucial summer monsoon rains were described as follows by the Sanitary Commissioner, “The monsoon rains (June to September) began earlier than usual, but were very weak over nearly the whole country outside of Burma and northeast India. The deficiency in the seasonal rainfall was as much as 81 percent… ” Bombay where the “rainfall was very defective” and the summer monsoon ended early, the survival and transmission of the virus may have been spurred during the autumn. In Madras, which experiences a winter monsoon, the autumn wave had to contend with an abnormally wet November, which may have stopped the pandemic.
Meanwhile, Bihar and Bengal were relatively unaffected by the shortfall in rains in that year and also the least affected by the pandemic. Calcutta, which had a wetter and longer summer monsoon than Bombay, may have been spared the virulence of the pandemic because of higher humidity. Indeed, the Sanitary Commissioner noted on several occasions in his report that the low mortality rate along the coast lines was striking, lending further support to this humidity hypothesis.

A number of additional factors may also have been at play. These include knowledge of the pandemic that may have reached the eastern part of the country via conferences held on the topic, allowing simple social distancing measures to be enacted and early detection through influenza awareness of inspectors and doctors, thereby lowering virulence.
Another possible interpretation is that populations in the north and east of India may have acquired a higher degree of immunity, or cross-protection from the first wave of the influenza and therefore were not as severely affected by the second wave as their southern and western counterparts.
The deceleration of the epidemic as it radiated outward from Bombay may also have resulted from multiple influenza carriers being introduced at once into a susceptible population in Bombay, thereby spreading the virus faster, while fewer influenza carriers travelled across the country on account of the rapid and severe onset of the disease. Finally, rurality may have contributed to the weakening of the pandemic’s spread.
These lessons from the deadliest pandemic in history are important for those working on developing welfare and economic policy, vaccine and medication, and health infrastructure. It also provides an important perspective for those simply grappling with the uncertainties of the moment.
You can read an entire paper on this subject by Siddharth Chandra and Eva Kassens-Noor here.
1471-2334-14-510
Professor Siddharth Chandra teaches at James Madison College. His research interests include behaviour and policy relating to addictive substances, the intersection of economics, health, and history in Asia, and applications of portfolio theory to fields outside finance, for which the theory was originally developed. You can read more about him and his work here.
| 2500 BC - Present | |
|
2500 BC - Present |
| Tribal History: Looking for the Origins of the Kodavas | |
| 2200 BC to 600 AD | |
|
2200 BC to 600 AD |
| War, Political Violence and Rebellion in Ancient India | |
| 400 BC to 1001 AD | |
|
400 BC to 1001 AD |
| The Dissent of the ‘Nastika’ in Early India | |
| 600CE-1200CE | |

|
600CE-1200CE |
| The Other Side of the Vindhyas: An Alternative History of Power | |
| c. 700 - 1400 AD | |
|
c. 700 - 1400 AD |
| A Historian Recommends: Representing the ‘Other’ in Indian History | |
| c. 800 - 900 CE | |

|
c. 800 - 900 CE |
| ‘Drape me in his scent’: Female Sexuality and Devotion in Andal, the Goddess | |
| 1192 | |
|
1192 |
| Sufi Silsilahs: The Mystic Orders in India | |
| 1200 - 1850 | |
|
1200 - 1850 |
| Temples, deities, and the law. | |
| c. 1500 - 1600 AD | |
|
c. 1500 - 1600 AD |
| A Historian Recommends: Religion in Mughal India | |
| 1200-2020 | |

|
1200-2020 |
| Policing Untouchables and Producing Tamasha in Maharashtra | |
| 1530-1858 | |

|
1530-1858 |
| Rajputs, Mughals and the Handguns of Hindustan | |
| 1575 | |
|
1575 |
| Abdul Qadir Badauni & Abul Fazl: Two Mughal Intellectuals in King Akbar‘s Court | |
| 1579 | |
|
1579 |
| Padshah-i Islam | |
| 1550-1800 | |
|
1550-1800 |
| Who are the Bengal Muslims? : Conversion and Islamisation in Bengal | |
| c. 1600 CE-1900 CE | |

|
c. 1600 CE-1900 CE |
| The Birth of a Community: UP’s Ghazi Miyan and Narratives of ‘Conquest’ | |
| 1553 - 1900 | |

|
1553 - 1900 |
| What Happened to ‘Hindustan’? | |
| 1630-1680 | |

|
1630-1680 |
| Shivaji: Hindutva Icon or Secular Nationalist? | |
| 1630 -1680 | |
|
1630 -1680 |
| Shivaji: His Legacy & His Times | |
| c. 1724 – 1857 A.D. | |
|
c. 1724 – 1857 A.D. |
| Bahu Begum and the Gendered Struggle for Power | |
| 1818 - Present | |

|
1818 - Present |
| The Contesting Memories of Bhima-Koregaon | |
| 1831 | |

|
1831 |
| The Derozians’ India | |
| 1855 | |

|
1855 |
| Ayodhya 1855 | |
| 1856 | |
|
1856 |
| “Worshipping the dead is not an auspicious thing” — Ghalib | |
| 1857 | |
|
1857 |
| A Subaltern speaks: Dalit women’s counter-history of 1857 | |
| 1858 - 1976 | |

|
1858 - 1976 |
| Lifestyle as Resistance: The Curious Case of the Courtesans of Lucknow | |
| 1883 - 1894 | |

|
1883 - 1894 |
| The Sea Voyage Question: A Nineteenth century Debate | |
| 1887 | |
|
1887 |
| The Great Debaters: Tilak Vs. Agarkar | |
| 1893-1946 | |
|
1893-1946 |
| A Historian Recommends: Gandhi Vs. Caste | |
| 1897 | |
|
1897 |
| Queen Empress vs. Bal Gangadhar Tilak: An Autopsy | |
| 1913 - 1916 Modern Review | |
|
1913 - 1916 |
| A Young Ambedkar in New York | |
| 1916 | |
|
1916 |
| A Rare Account of World War I by an Indian Soldier | |
| 1917 | |

|
1917 |
| On Nationalism, by Tagore | |
| 1918 - 1919 | |
|
1918 - 1919 |
| What Happened to the Virus That Caused the World’s Deadliest Pandemic? | |
| 1920 - 1947 | |
|
1920 - 1947 |
| How One Should Celebrate Diwali, According to Gandhi | |
| 1921 | |
|
1921 |
| Great Debates: Tagore Vs. Gandhi (1921) | |
| 1921 - 2015 | |

|
1921 - 2015 |
| A History of Caste Politics and Elections in Bihar | |
| 1915-1921 | |

|
1915-1921 |
| The Satirical Genius of Gaganendranath Tagore | |
| 1924-1937 | |
|
1924-1937 |
| What were Gandhi’s Views on Religious Conversion? | |
| 1900-1950 | |
|
1900-1950 |
| Gazing at the Woman’s Body: Historicising Lust and Lechery in a Patriarchal Society | |
| 1925, 1926 | |
|
1925, 1926 |
| Great Debates: Tagore vs Gandhi (1925-1926) | |
| 1928 | |
|
1928 |
| Bhagat Singh’s dilemma: Nehru or Bose? | |
| 1930 Modern Review | |
|
1930 |
| The Modern Review Special: On the Nature of Reality | |
| 1932 | |
|
1932 |
| Caste, Gandhi and the Man Beside Gandhi | |
| 1933 - 1991 | |

|
1933 - 1991 |
| Raghubir Sinh: The Prince Who Would Be Historian | |
| 1935 | |

|
1935 |
| A Historian Recommends: SA Khan’s Timeless Presidential Address | |
| 1865-1928 | |

|
1865-1928 |
| Understanding Lajpat Rai’s Hindu Politics and Secularism | |
| 1935 Modern Review | |
|
1935 |
| The Modern Review Special: The Mind of a Judge | |
| 1936 Modern Review | |
|
1936 |
| The Modern Review Special: When Netaji Subhas Bose Was Wrongfully Detained for ‘Terrorism’ | |
| 1936 | |

|
1936 |
| Annihilation of Caste: Part 1 | |
| 1936 Modern Review | |
|
1936 |
| The Modern Review Special: An Indian MP in the British Parliament | |
| 1936 | |
|
1936 |
| Annihilation of Caste: Part 2 | |
| 1936 | |

|
1936 |
| A Reflection of His Age: Munshi Premchand on the True Purpose of Literature | |
| 1936 Modern Review | |
|
1936 |
| The Modern Review Special: The Defeat of a Dalit Candidate in a 1936 Municipal Election | |
| 1937 Modern Review | |

|
1937 |
| The Modern Review Special: Rashtrapati | |
| 1938 | |
|
1938 |
| Great Debates: Nehru Vs. Jinnah (1938) | |
| 1942 Modern Review | |

|
1942 |
| IHC Uncovers: A Parallel Government In British India (Part 1) | |
| 1943-1945 | |
|
1943-1945 |
| Origin Of The Azad Hind Fauj | |
| 1942-1945 | |
|
1942-1945 |
| IHC Uncovers: A Parallel Government in British India (Part 2) | |
| 1946 | |

|
1946 |
| Our Last War of Independence: The Royal Indian Navy Mutiny of 1946 | |
| 1946 | |
|
1946 |
| An Artist’s Account of the Tebhaga Movement in Pictures And Prose | |
| 1946 – 1947 | |

|
1946 – 1947 |
| “The Most Democratic People on Earth” : An Adivasi Voice in the Constituent Assembly | |
| 1946-1947 | |
|
1946-1947 |
| VP Menon and the Birth of Independent India | |
| 1916 - 1947 | |
|
1916 - 1947 |
| 8 @ 75: 8 Speeches Independent Indians Must Read | |
| 1947-1951 | |
|
1947-1951 |
| Ambedkar Cartoons: The Joke’s On Us | |
| 1948 | |

|
1948 |
| “My Father, Do Not Rest” | |
| 1940-1960 | |

|
1940-1960 |
| Integration Myth: A Silenced History of Hyderabad | |
| 1948 | |
|
1948 |
| The Assassination of a Mahatma, the Princely States and the ‘Hindu’ Nation | |
| 1949 | |
|
1949 |
| Ambedkar warns against India becoming a ‘Democracy in Form, Dictatorship in Fact’ | |
| 1950 | |

|
1950 |
| Illustrations from the constitution | |
| 1951 | |
|
1951 |
| How the First Amendment to the Indian Constitution Circumscribed Our Freedoms & How it was Passed | |
| 1967 | |
|
1967 |
| Once Upon A Time In Naxalbari | |
| 1970 | |
|
1970 |
| R.C. Majumdar on Shortcomings in Indian Historiography | |
| 1973 - 1993 | |
|
1973 - 1993 |
| Balasaheb Deoras: Kingmaker of the Sangh | |
| 1975 | |
|
1975 |
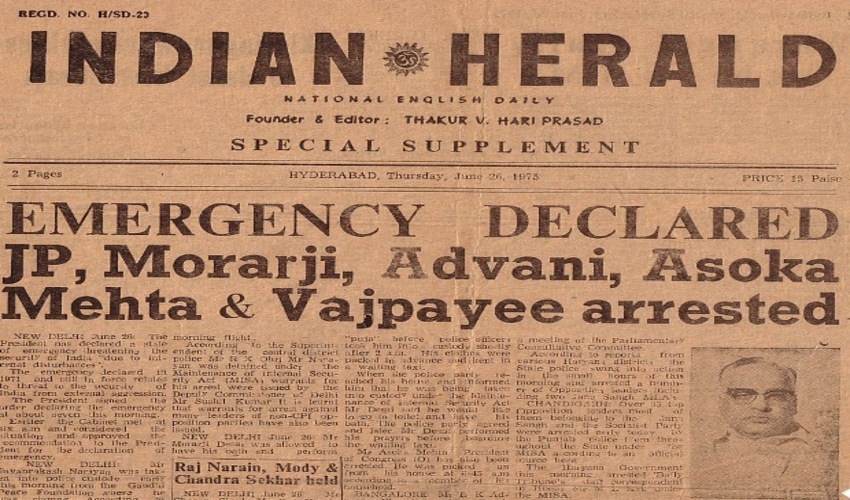
| The Emergency Package: Shadow Power | |
| 1975 | |

|
1975 |
| The Emergency Package: The Prehistory of Turkman Gate – Population Control | |
| 1977 – 2011 | |
|
1977 – 2011 |
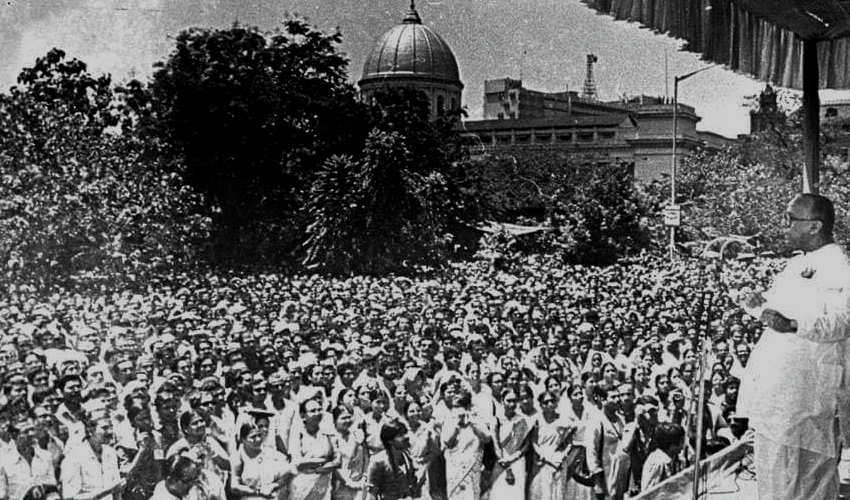
| Power is an Unforgiving Mistress: Lessons from the Decline of the Left in Bengal | |
| 1984 | |
|
1984 |
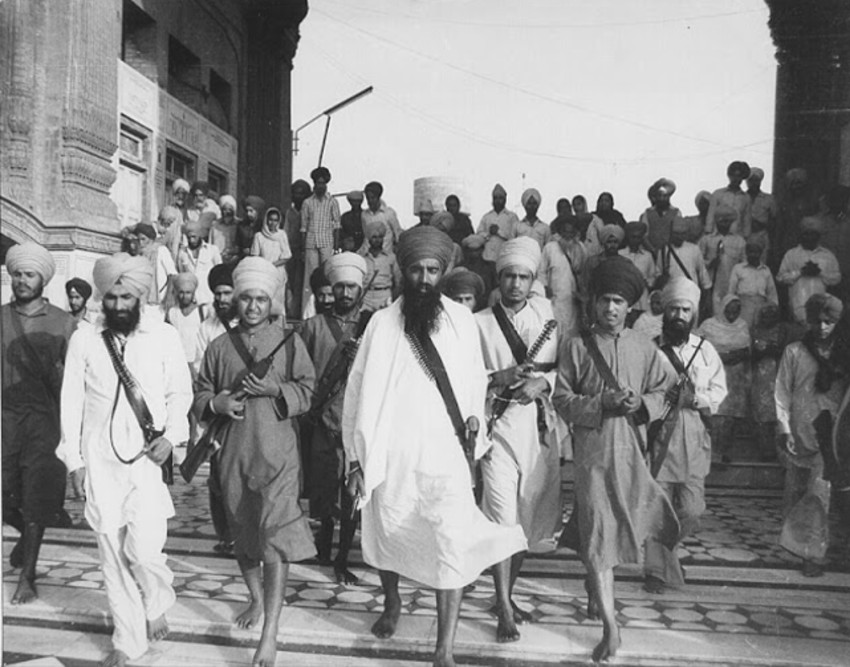
| Mrs Gandhi’s Final Folly: Operation Blue Star | |
| 1916-2004 | |
|
1916-2004 |
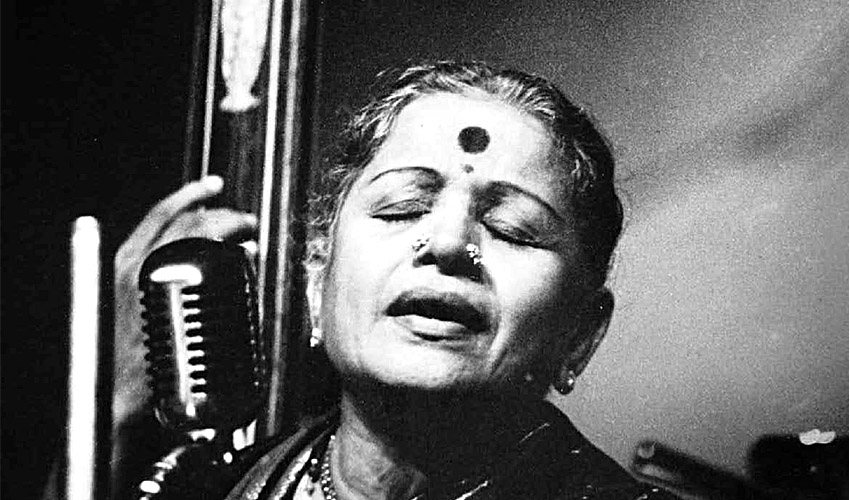
| Amjad Ali Khan on M.S. Subbulakshmi: “A Glorious Chapter for Indian Classical Music” | |
| 2008 | |
|
2008 |
| Whose History Textbook Is It Anyway? | |
| 2006 - 2009 | |
|
2006 - 2009 |
| Singur-Nandigram-Lalgarh: Movements that Remade Mamata Banerjee | |
| 2020 | |

|
2020 |
| The Indo-China Conflict: 10 Books We Need To Read | |
| 2021 | |
|
2021 |
| Singing/Writing Liberation: Dalit Women’s Narratives | |
Leave a Reply